NOCTI offers a substantial library of pre-tests for Career and Technical Education (CTE) programs, encompassing over 125 occupational areas. In earlier blogs, we’ve highlighted the benefits of a pre-test, such as identifying competency gaps, helping students to set learning goals, reducing test anxiety, and more.
To make these pre-tests more effective for both teachers and administrators, it’s helpful for CTE teachers to develop some data analytics skills. Learning how to interpret data and make effective improvements is a natural next step to ensure everyone gets the full benefit from the pre-tests. Let’s explore four data “detective skills” for analyzing pre-test data.
Please note that NOCTI has two pre-testing windows. Contact NOCTI or your Site Coordinator to learn more about the allowable and most effective pre-testing windows.
1. Prioritize Data Based on Goals
The educational sphere gathers vast amounts of data from various levels, including the classroom, school, district, state, and national. This data includes enrollment numbers, attendance records, standardized test scores, assessments, aptitude tests, and evaluations of both the classroom and teachers, among many other metrics.
It’s easy to get overwhelmed by the amount of data available to CTE professionals.
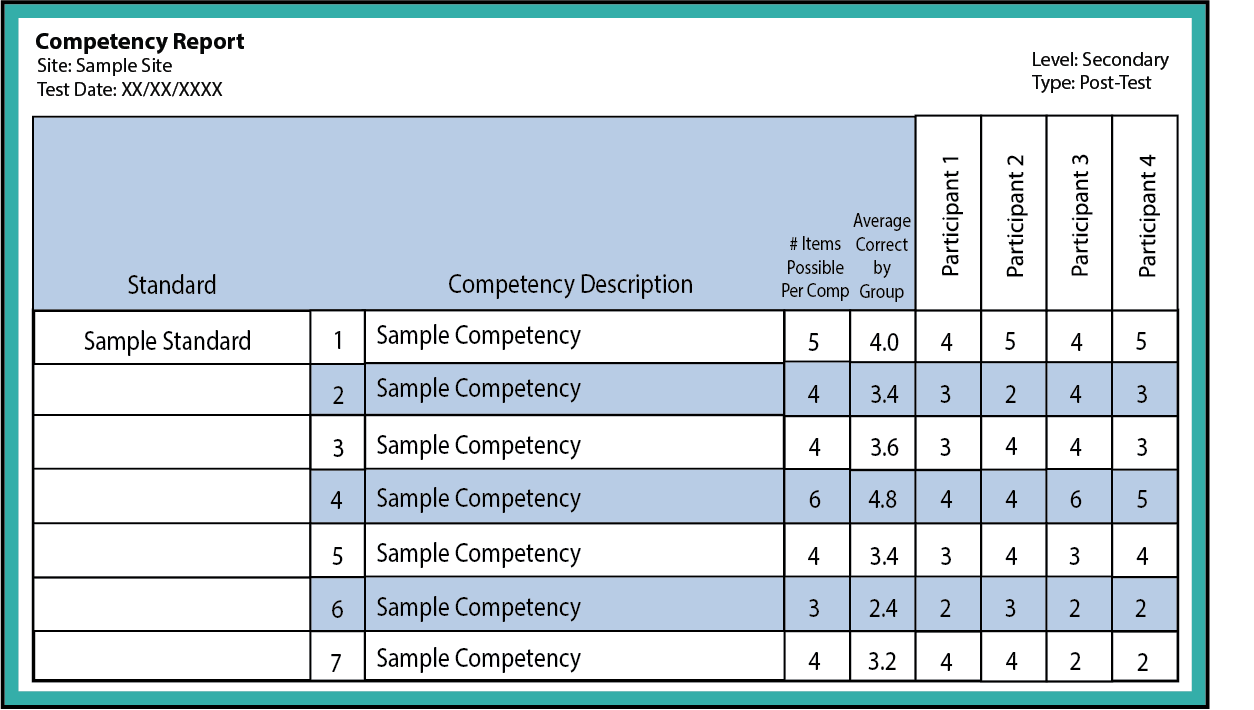
When analyzing CTE program data, such as pre-test scores, it’s important to prioritize the data that aligns with specific goals. For instance, if the objective is to help the entire class improve before post-testing, a competency report may be the most useful tool. A competency report gives results for each participant and the average score for the group.

Teachers may want to review the report and identify any competencies where the average score falls below 50%. These areas indicate where the class could benefit from additional instruction. Revisiting the material for those specific competencies or allocating extra class time to answer students’ questions could be beneficial.
2. Recognize Patterns and Trends
While our brains are wired to recognize patterns, data sometimes needs to be reorganized to make those patterns easier to spot. When it comes to pre-test assessments, comparing current class performance with data from previous years can help identify whether a trend exists or if it is an isolated occurrence. Did every class over the past five years score below 50% on a specific competency? This pattern may signal the need for a curriculum adjustment to address the learning gap.
3. Use Insights for Individualized Instruction
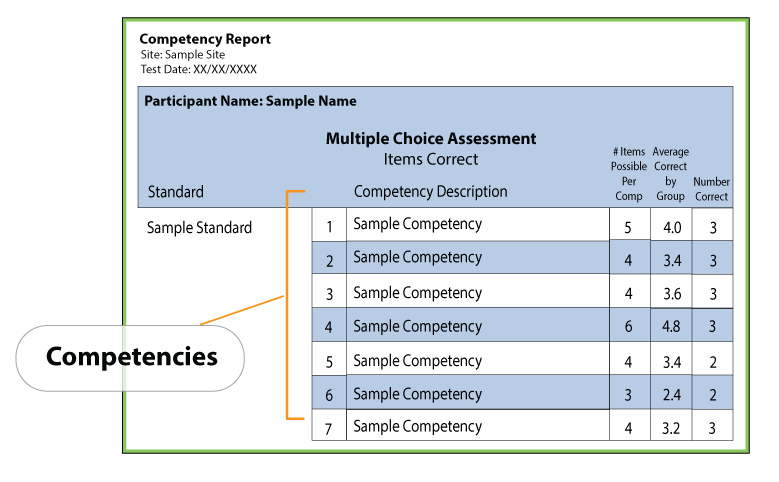
The primary benefit of the pre-test is using the data to improve student success. An individual competency report breaks down scores by standard, showing both the strengths and areas for improvement. By reviewing these, teachers and students can identify areas to focus on during study time.

4. Triangulate to Find the “Why”
Identifying a pattern or trend in data doesn’t always reveal the underlying cause. For example, classes with the same instructor may show different areas of strengths and weaknesses. CTE professionals must do some additional detective work to theorize the “why” behind the trend.
In trigonometry and geometry, triangulation refers to using known factors to determine an unknown point. In data analysis, triangulation uses multiple data sources, methods, or perspectives to develop a more comprehensive understanding of the data.
For example, the differences between two seemingly identical classes could be the time of day. Students in a morning class may not be as alert as students in an afternoon class. To test this theory, a teacher might try incorporating warm-up activities to boost engagement in the earlier class.
Correlation Does Not Equal Causation
The risk of triangulation lies in drawing incorrect assumptions. While time of day in the previous example could be a factor, another possibility is that students more confident in their career path may have quickly signed up for the more desirable class time, while less committed students slowly filled the less desirable time slots. This could lead to notable differences in engagement, learning, and information retention.
It’s important to remember that correlation does not imply causation. Instructors who recognize this fallacy will understand that correlating data often requires a deeper dive to determine if there is an actual cause-and-effect relationship.
More Tools to Help CTE Instructors and Administrators Analyze Data
Collecting pre-test data is only effective if it is analyzed and used to make meaningful changes. NOCTI offers several tools and resources to help equip CTE professionals with the data skills to make highly effective decisions.
- Pre-Testing and Data Webinar: Gain insight into how to best utilize NOCTI pre-testing for program and student success. This webinar recording (along with many others) is available on-demand from NOCTI’s website.
- The Secret Recipe of Rockstar Teachers: NOCTI’s newest guide features three researched-backed strategies designed to empower CTE teachers and help them create an environment where learners thrive. This guide is perfect for CTE teachers settling into their first year and more seasoned educators looking for professional development opportunities.
- Putting Your Data to Work: Explore the various aspects of data-driven instruction with how-to examples and tips for all CTE professionals in this collaborative publication by NOCTI and ACTE.
