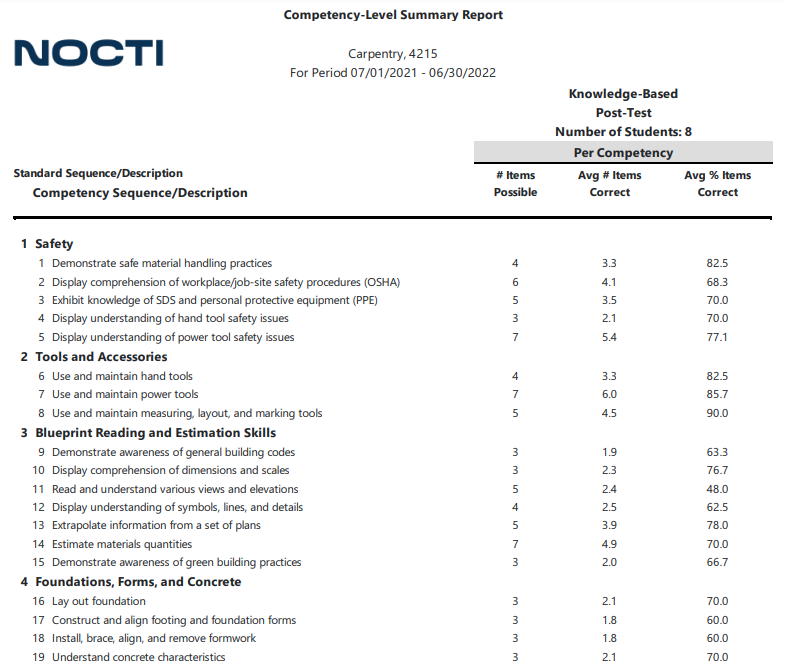
NOCTI competency reports list scores for each competency in a particular standard. For example, the carpentry assessment includes a safety standard. This standard breaks down into five specific competencies students will be tested on during the written assessment:
- Demonstrate safe material handling practices
- Display comprehension of workplace/job-site safety procedures (OSHA)
- Exhibit knowledge of SDS and personal protective equipment (PPE)
- Display understanding of hand tool safety issues
- Display understanding of power tool safety issues
Analyzing scoring data from competency reports often yields helpful insights that CTE professionals can use to increase student success and make program improvements.
Note: competencies are listed in each assessment’s Blueprint. You can access Blueprints in the Blueprint Index.
Individual & Summary Competency Reports
NOCTI offers two kinds of competency reports as part of its customer reporting package: individual and summary reports.
Individual Competency Reports
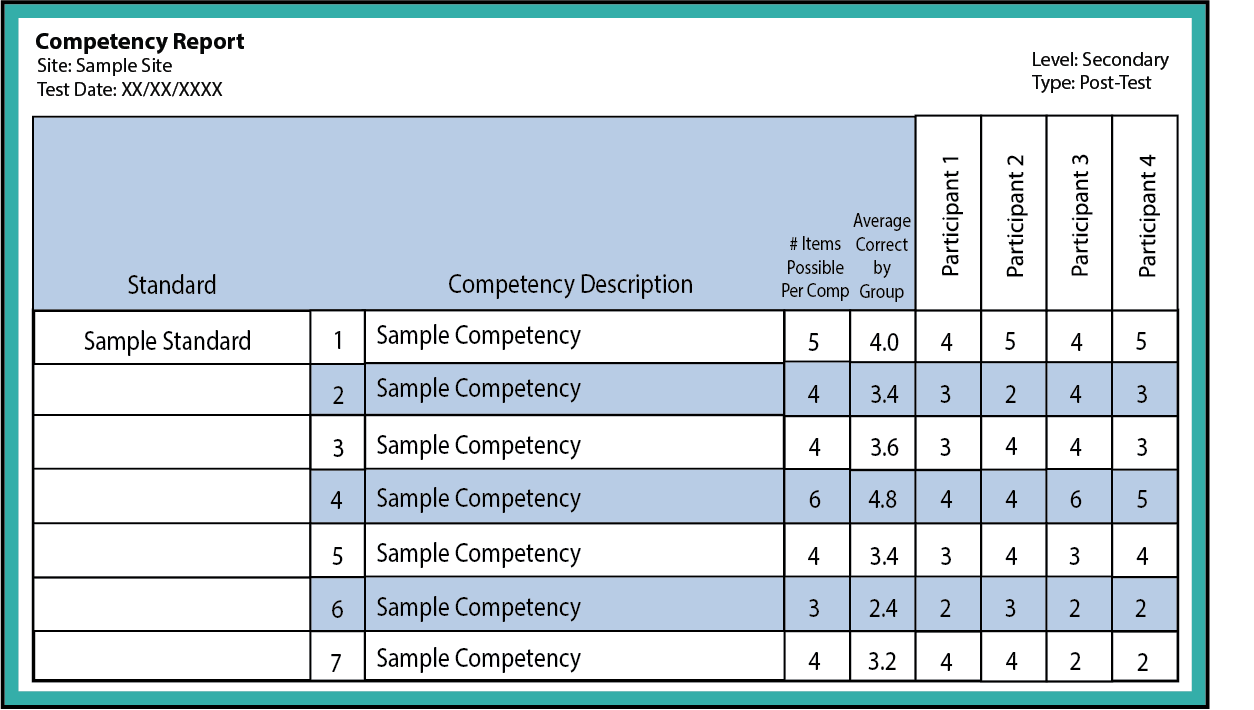
Individual competency reports list the number of items per competency. Reviewing the average answered correctly for the group and the number of items answered correctly for individual students can provide insightful information to support learning.

The individual competency reports are available for both the multiple-choice knowledge-based assessments and the skills-based performance assessments.
For knowledge-based assessments, the report lists:
- Number of items possible for each competency
- Average correct by group
- Number of correct items by participant
For skill-based assessments, the report lists:
- Number of possible for each job
- Average points earned by group
- Number of points awarded by participant
Competency Summary Report
Competency summary reports provide data for each standard at a classroom level. Users can enter a date range and filter to specific titles to export data for all students who took the test within that period of time. Various data filters result in a customized data extract for your specific needs.

Insights for Student Improvement
Once competency reports are downloaded, you can gather insights about individual scores and how a group performed as a whole. Reviewing scores and pinpointing areas for improvement helps highlight what is most beneficial to focus on between the pre-test and post-test.
Todd Luke, president of Max Teaching, shared some helpful tips for analyzing competency reports during a NOCTI webinar. The following exercise provides two quick examples of putting this valuable data to use.
Exercise: Analyze an Individual Competency Report
Export an individual competency report in Excel. Filter the data by the “average correct by group” in descending order from highest to lowest. Highlight each competency where the group as a whole averaged less than 50% correct.
This exercise is not meant to be negative or point out student failures. Rather, this lets you see specific areas where the class may need additional instruction. Perhaps you will want to review the material again or schedule extra class time to answer student’s questions in those areas.
Now, for each student, highlight the competencies where individuals averaged less than 50% correct. Using a student study guide, have the student analyze their own performance and identify areas they should focus on during their study time.
Insights for Program Improvement
Competency summary reports show longitudinal data, including how many students have taken the test within specific dates, the standard and competency, the number of items per competency, the average number of items correct, and the percentage of the average number correct. This report can help you understand how well your curriculum prepares students for the post-test at the end of the program.
Exercise: Analyze a Competency Summary Report
Export a competency summary report in Excel. Filter the data by the “average % items correct” in descending order from highest to lowest.
Take note of any competency where the average falls below 50%. Since this report includes historical data within a specified date range, you can pinpoint areas where students have consistently performed poorly. This should prompt additional investigation into student achievement, teacher instruction, and/or the curriculum being used.
- Has there been an impact from a new curriculum or facility?
- Are there performance differences among subgroups of students?
- Does the same assessment show differences between instructors (e.g., a two-teacher program) or between two groups of students (e.g., a.m. or p.m. session)?
You can perform a similar analysis of performance tests and highlight areas for potential program improvement.
Need Help Putting Your Data To Work?
NOCTI offers support and resources for CTE professionals looking to use their data to fuel student success and make program improvements. Here are some additional resources of interest:
- Putting Your Data to Work: Explore the various aspects of data-driven instruction with how-to examples and tips for all CTE professionals in this collaborative publication by NOCTI and ACTE.
- Connecting Data to CTE Program Improvement: Learn more about how data connects to CTE program improvement and helps equip future workforces for success in this blog post.
- Competency Data for Planning and PD Webinar. CTE educators want to know if students are learning and retaining what is being taught and how to use data to make informed improvements to the program content. Watch this webinar to take a deeper look at the competency reports from the teacher resource center and how to make them work for you!
